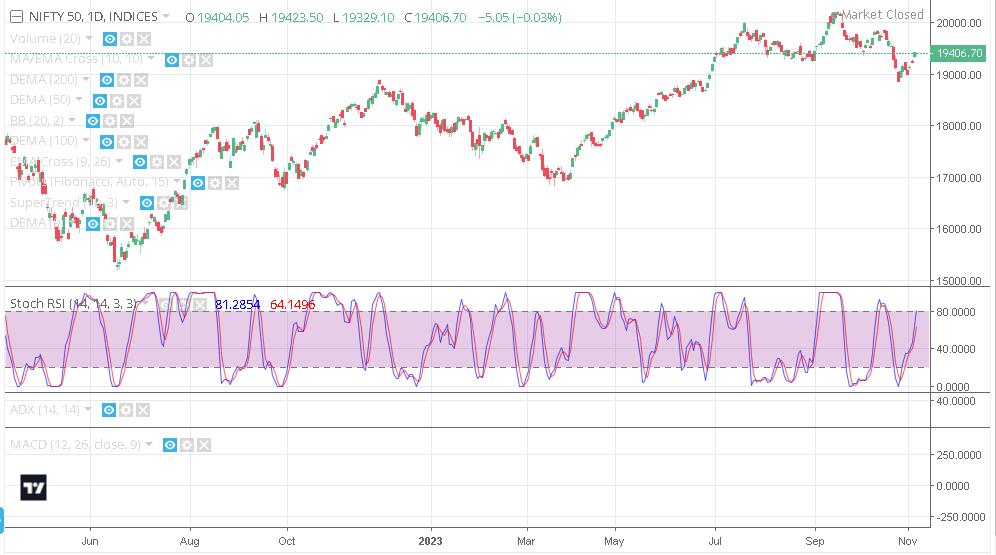
In the realm of trading, the ability to pinpoint entry and exit points is the ultimate key to success. The Relative Strength Index (RSI) indicator is a powerful tool in the trader’s arsenal, offering insights into potential trade opportunities. In this comprehensive guide, we will explore how to leverage the RSI indicator effectively to extract entry and exit price points with accuracy and confidence.
1. Understanding the RSI Indicator
RSI Indicator, Momentum Oscillator, Trading Tool
The Relative Strength Index (RSI) is a momentum oscillator that gauges the velocity and magnitude of price movements. Traders commonly use it to identify overbought and oversold conditions in the market, making it a valuable tool for entry and exit strategies.

2. Choosing the Right RSI Parameters
RSI Parameters, Indicator Settings, Customization
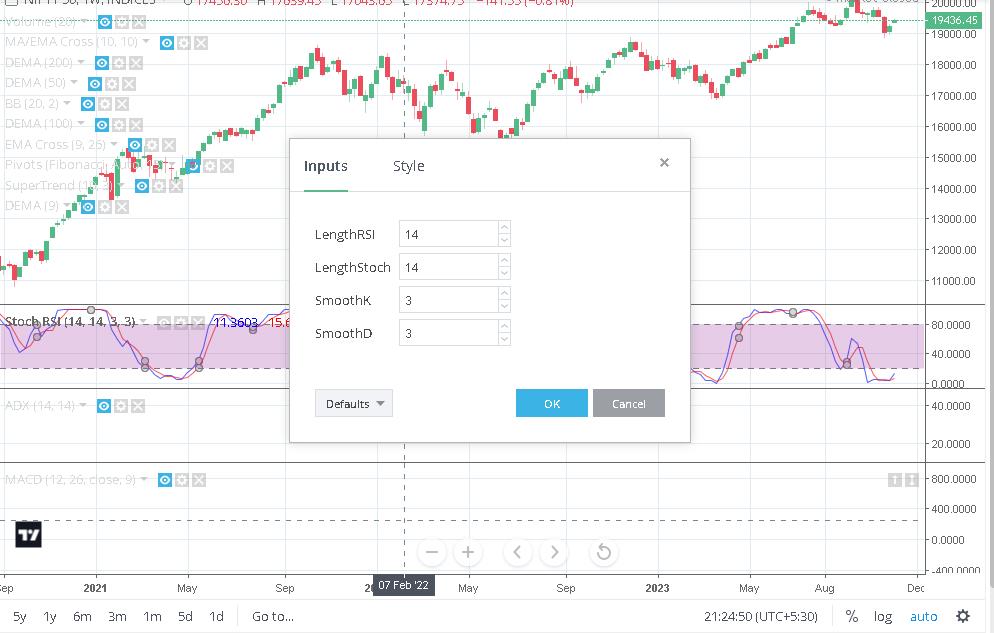
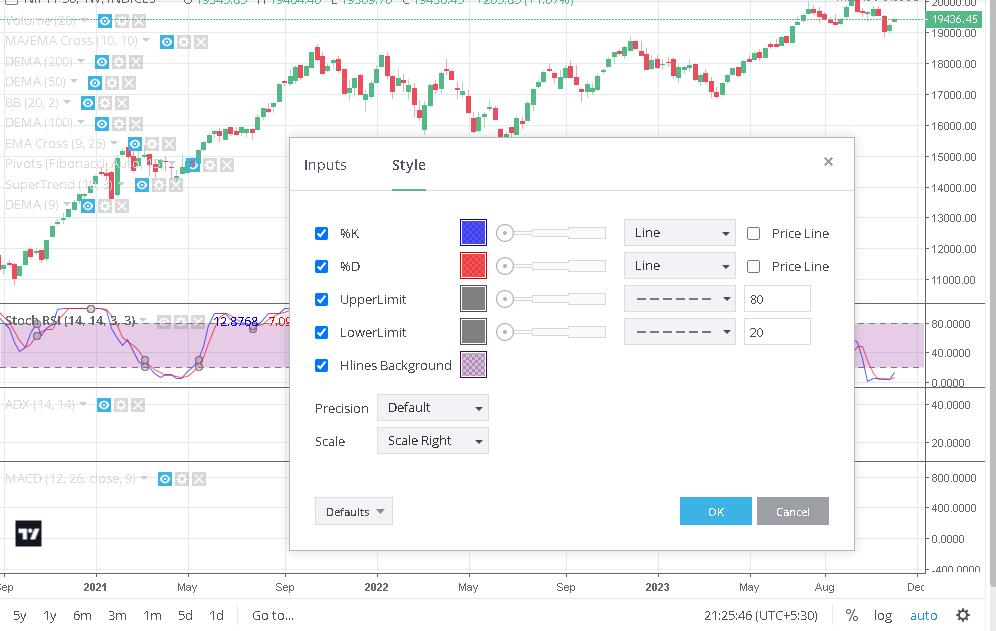
To effectively use the RSI, it’s crucial to select the right parameters. The RSI typically employs a 14-period lookback but can be adjusted to match your trading strategy and timeframe. The standard levels for overbought and oversold conditions are 70 and 30, respectively, but these can also be tailored to your preferences.


3. Mastering Entry Points with RSI
Entry Points, Trading Signals, RSI Crossovers
Effective entry points are the cornerstone of successful trading. Here’s how to use the RSI indicator to identify entry opportunities:
- Overbought/Oversold Conditions: The RSI signals overbought conditions when it rises above 70 and oversold conditions when it falls below 30. Look for potential entry points when the RSI crosses into these extreme levels, suggesting a reversal in price direction.
- Divergence and Convergence: Observe the RSI for divergences from the price. Bullish divergence, where the RSI makes higher lows while the price makes lower lows, can signal a potential entry for a long trade. Conversely, bearish divergence, where the RSI forms lower highs while the price forms higher highs, may suggest an entry for a short trade.
- RSI Trend Confirmation: Use the RSI to confirm the direction of the trend. When the RSI consistently remains above 50, it confirms a bullish trend, indicating potential entry points for long trades. Conversely, when the RSI consistently stays below 50, it confirms a bearish trend, suggesting entry points for short trades.
4. Navigating Exit Points with RSI
Exit Points, Profit Booking, RSI Reversals
Effective exit points are crucial for locking in profits and managing risk:
- Crossing Back into Neutral Range: To identify exit points, watch for the RSI crossing back into the neutral range (between 30 and 70). For instance, if you’re in a long trade and the RSI crosses from above 70 back below it, it may signal an exit point.
- Trend Reversal Confirmation: The RSI can also confirm trend reversals. If the RSI starts crossing below 50 after being above it, it may signal an exit from a long trade and a potential entry into a short trade, indicating a trend reversal.
- Using Other Technical Indicators: Consider using the RSI in conjunction with other technical indicators or chart patterns to confirm exit points. If the RSI suggests overbought conditions but a bearish reversal pattern appears on the price chart, it may be a strong signal to exit a long trade or enter a short trade.
5. Combining RSI with Other Indicators
Indicator Combinations, Trading Strategy, Precision
While the RSI is a powerful tool on its own, combining it with other technical indicators can enhance the precision of your entry and exit points. Create a well-rounded trading strategy by integrating various technical indicators that complement each other.
6. Practice, Backtesting, and Risk Management
Trading Practice, Backtesting, Risk Management
Before implementing your RSI-based strategies in live trading, practice on historical data and backtest your approaches. To preserve your wealth, use risk management strategies such as setting stop-loss and take-profit thresholds.
Conclusion: Achieving Trading Success with RSI Mastery
Trading Success, RSI Mastery, Effective Trading Strategies
Mastering the RSI indicator is a journey that combines knowledge, practice, and a deep understanding of market dynamics. By selecting the right parameters, fine-tuning your strategies, and applying risk management principles, you can confidently navigate the world of trading and extract entry and exit price points with precision. Happy trading!

Comments are closed.